


September 2026
Helping SEMI Address the Emissions Data Gap for Semiconductors




Thank you for registering


August 2026
Copper prices hit records in early 2026, but the tightest point in the chain is smelting and refining, where processing fees fell to zero and capacity keeps concentrating. For copper-intensive products, that turns a commodity story into an allocation and requalification problem that a tier-1 BoM cannot show you.
Looking to subscribe to our newsletter? Click here.
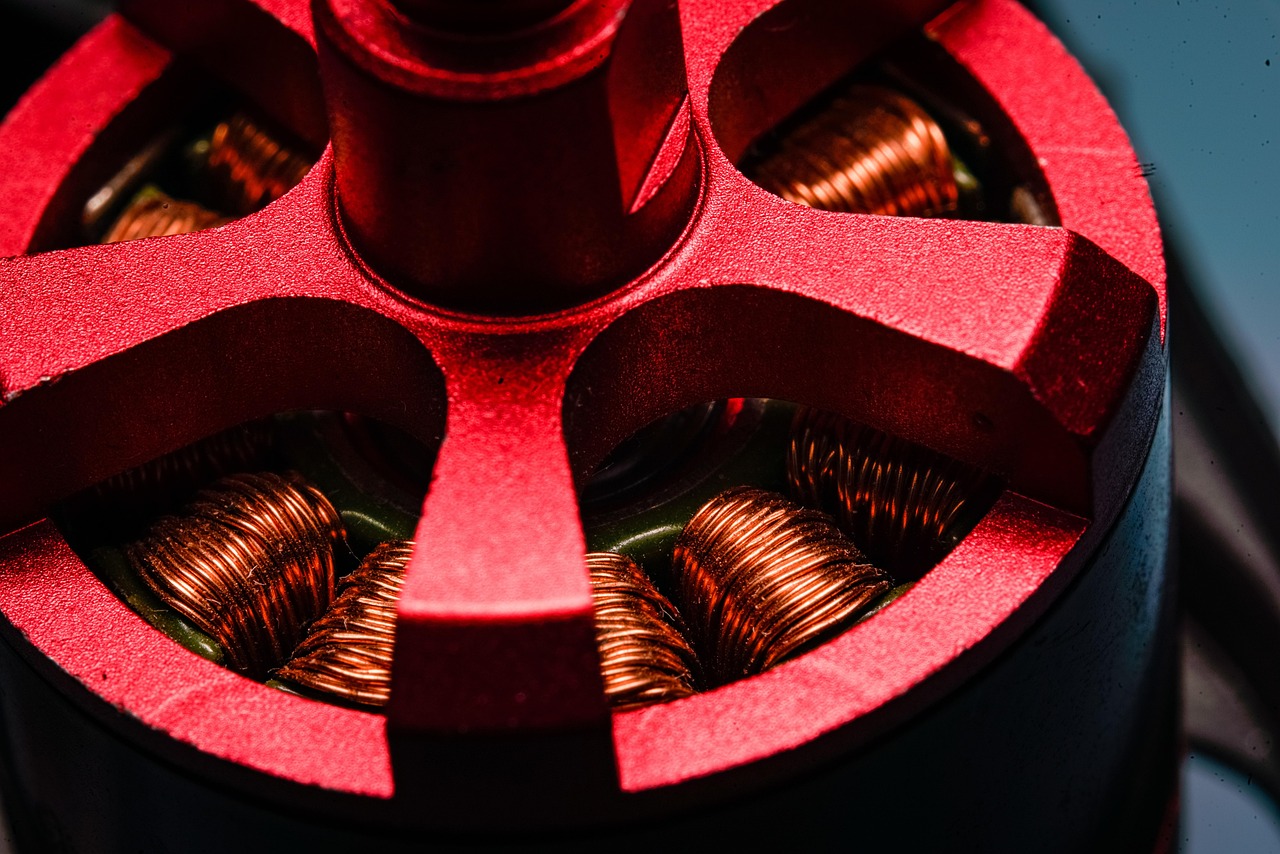
Copper enters a Bill of Material (BoM) as a finished part. A wiring harness, a motor winding, a busbar, a transformer coil, a switchgear assembly. The line item carries a supplier name and a part number. It does not carry the cathode grade behind that part, the refinery that produced the cathode, or the concentrate that fed the refinery.
That gap has become expensive in 2026. Copper prices reached records early in the year, briefly exceeding USD 14,500 per tonne intraday in January after passing USD 12,000 per tonne for the first time only in December 2025. Mine supply constraints explain part of that, and they are widely covered. The pressure that now decides which buyers receive metal on schedule sits one step further downstream, in smelting and refining.
A midstream squeeze occurs when the processing step between raw material and usable input becomes the binding constraint on supply. For copper, that step converts mined concentrate into refined cathode that fabricators draw on.
Smelters earn processing income through treatment and refining charges, the fees a miner pays to have concentrate turned into metal. When concentrate is scarce relative to installed smelting capacity, smelters compete for feed and those fees fall. In January 2026 the annual benchmark, negotiated between Chilean miner Antofagasta and major Chinese smelters, settled at USD 0 per tonne, the lowest level ever agreed and down from roughly USD 21 per tonne in 2025. Spot charges, according to the same IEA analysis, have been negative since 2024, which means a smelter pays a miner for the right to process the miner's material.
The structural picture behind that number is slow to change. Average global copper ore grades have declined 40% since 1991, and only 5% of the copper deposits found in the last 35 years were found in the last decade. The IEA puts the lead time for a new project at around 17 years from discovery to production, and on the current pipeline anticipates the copper market could face a supply deficit of 30% by 2035. Recycled copper eases the arithmetic at the margin, and it does not change the timeline for new primary supply.
Record metal prices have not protected the companies that process the metal, and the operational response is already visible in public filings and announcements.
Some custom smelters, which buy concentrate on the market rather than sourcing it from affiliated mines, have cut primary output. Mitsubishi Materials said it will reduce primary copper smelting volumes by 30% to 40% by 2035. Others have needed public money to stay open: Australia committed AUD 395 million to support Glencore's copper smelter in October 2025.
Several have gone looking for different feedstock instead. JX Advanced Metals is lifting processing capacity for recycled materials, because scrap is not exposed to treatment charges the way concentrate is. On the contracting side, Freeport is breaking away from the benchmark it helped set for decades. The IEA also records traders securing multi-year concentrate and anode supply through prepayment deals priced independently of the benchmark.
Where capacity survives, it keeps concentrating. China's top smelters have agreed to cut production by over 10% in 2026 to address negative processing fees, and Beijing has halted roughly 2 million tonnes of planned new smelting capacity. Neither is enough to rebalance the market. On IEA figures, China still accounts for around half of global copper smelting output and is the top refiner for 19 of 20 strategic minerals, with an average market share near 70%.
There is a recent precedent for what that concentration does to a production schedule. The IEA notes that China's rare earth export controls in April 2025 caused temporary production halts across the global automotive industry, which is the same shape of problem told through a smaller market. We covered that pattern in When the Magnets Run Out, and the grid-equipment version of it in How a Power Chokepoint Stalls a Data Center Buildout.
For a manufacturer of copper-intensive products, a midstream squeeze shows up in four ways before it ever shows up as a headline price.
Take a low-voltage switchgear assembly. The BoM lists a busbar set, a contactor, a control transformer, an internal harness and an enclosure. Four of those five carry copper, in different forms and at different points in their own production. The busbar is close to raw cathode and reprices quickly. The transformer coil sits behind a winding operation with its own queue, so a squeeze reaches it later and stays longer. The harness aggregates copper from several conductor suppliers, and that aggregation is the usual site of upstream convergence.
Ask which of those five lines is most exposed and copper mass turns out to be a poor guide. The binding line is usually the one whose supplier has the least flexibility on refining source and the longest requalification path. Identifying it requires the material and process behind each line together with the upstream path behind each supplier.
This exposure is knowable. The difficulty is that reconstructing it by hand across hundreds of line items and thousands of parameters takes long enough that the answer arrives after the sourcing decision is made. While a cost engineering team is assembling that picture, it is not pricing the alternates or building the case for a second source.
This is the work Muir AI automates. BoM comprehension reads an incoming BoM and resolves each line to a material and a process rather than a free-text description. Where supplier data or design specifications are missing, the platform generates a product twin from its material and manufacturing databases so modelling can continue without waiting on a quote, and without a physical unit to tear down. Supply chain mapping and Product Origin then trace those materials upstream, so copper-bearing parts and their refining-stage exposure surface as a set of named dependencies. Because the cost model is built from components rather than a historical index, alternates can be priced by process, geography, supplier and material against the same baseline, and the baseline updates when input costs move.
The output is a copper exposure list you can act on, in minutes rather than over a quarter: which parts carry the metal, which suppliers converge upstream, which substitutions hold up on cost, and what a requalification would cost in schedule.
Copper demand from electrification, data centres and defence is not going to soften on a timeline that helps procurement. The teams that handle it well will be the ones who can already see where the metal sits in their own products.
Ready to see where copper exposure hides in your BoM? Book a demo and bring one copper-intensive assembly. We will map the material path and price the alternates against a live cost baseline.
A midstream squeeze happens when smelting and refining, rather than mining, becomes the binding constraint on how much usable copper reaches buyers. Smelters are paid through treatment and refining charges. When concentrate is scarce relative to smelting capacity, smelters compete for feed and those charges collapse. The annual benchmark settled at USD 0 per tonne in January 2026, down from about USD 21 per tonne in 2025, and spot charges have been negative since 2024.
In a tight refined market, sellers allocate. Priority customers are served first and other buyers move into a queue, so a quoted lead time becomes a queue position. Switching to an alternative cathode source, alloy supplier or component vendor also requires requalification, which runs in weeks or months. The schedule impact usually lands before the price impact does.
Resolve every line item to the material and process behind it, not just the supplier name and part number, then trace those materials upstream to the refining and smelting stage. Two suppliers that look independent at tier one can draw cathode from the same refining region. Doing this by hand across hundreds of line items is slow enough that the answer often arrives after the sourcing decision, which is why the mapping is worth automating.
Yes. A component-level model built from material and process data can produce a defensible should-cost figure from limited inputs, including cases where no physical unit is available to tear down and no supplier quote exists. Muir generates a product twin to fill gaps in supplier data or design specifications, and every inferred value carries provenance so an engineer can see which fields were generated by the system, declared in the source, or edited by hand.

Don't worry, we don't spam.


Understand cost, navigate tariffs.

Drive deeper intelligence into product design cycles.

Scaled PCFs and reduction insights.

Determine your full supply chain and its cost.

Baseline your footprint and decarbonize.
Building Product Intelligence.
Find open roles at Muir.
Muir has plans for any scale.


